Loopio's seventh annual RFP Trends & Benchmarks Report, published in March 2026 from survey data across 1,533 response professionals, puts a number on something most industrial boards have never quantified: RFPs now influence roughly 40 percent of company revenue, and for the first time in the report's history, teams rank bandwidth as their number one challenge. At the same time, the Salesforce CPQ End of Sale has put every industrial OEM's quoting stack on the agenda. Companies are re-evaluating what their quote infrastructure should look like for the next decade. That makes this the right moment to ask a question few leadership teams can answer: what does a lost RFP actually cost you?
Why is the cost of a lost RFP invisible to industrial leadership?
The cost of a lost RFP is invisible because most of it never appears in any system leadership looks at. A CRM records the opportunities a salesperson chose to enter. It does not record the inquiry that sat in a shared inbox for six days before an estimator opened it, the RFQ the team declined because the two engineers who understood the scope were buried in another tender, or the bid that went out on time but non-compliant because a revised spec never made it into the compliance matrix.
For a pump OEM, a valve manufacturer, or an EPC subcontractor, each of those failure modes has the same financial signature: revenue that was available and was never won, with no line item recording the loss. The bid either was not submitted, was submitted late, or was submitted with an error that disqualified it. In every case the pipeline report shows nothing unusual, because the pipeline report only knows about the deals that made it in cleanly.
The delay side compounds quietly. An engineered tender response involves spec interpretation, engineering review, supplier pricing, and compliance documentation. When any stage queues behind scarce expertise, the response window shrinks, and the team's options narrow from "respond well" to "respond somehow" to "decline." None of those transitions is recorded anywhere.
Why don't CRM dashboards or CPQ reports capture it?
They don't capture it because both systems start counting after the costly part is over. This is a structural gap, not a configuration problem.
A CRM like Salesforce is a system of record for accounts and opportunities. It knows who you are talking to and what stage a deal is in. It has no visibility into the inquiry-to-order (ITO) workflow: the document-driven work of reading a buyer's specification, deciding whether to bid, and constructing a technically compliant response. A CPQ, whether Salesforce CPQ, Tacton, Configit, or Intelliquip, is a rules engine that configures a catalog product and prices it. It does genuine work once the team knows what it is quoting. Neither system sees the triage queue, the no-bid decision, or the compliance matrix where accuracy is actually won or lost. And Excel, where most bid tracking actually lives, records whatever someone remembered to type into it after the fact.
The Salesforce CPQ End of Sale, announced in March 2025, has sharpened this question for industrial manufacturers. Existing customers can keep renewing and adding licenses, but with the product closed to new customers and feature investment redirected, every CPQ owner is now weighing what their quoting stack should be going forward. The risk in that evaluation is scoping it as a configurator swap and never asking where bids are actually lost.

How do you actually benchmark industrial proposal response ROI?
Benchmarking proposal response ROI means measuring the full funnel of inquiries, not just the outcomes of submitted bids. Four practices separate teams that can answer the cost question from teams that cannot.
- Count every inquiry at the front door. The denominator for response ROI is inquiries received, not opportunities entered. That requires capturing every RFP, RFQ, and tender invitation at the moment it arrives, before a human decides whether it deserves a CRM record.
- Log the no-bid and its reason. A declined bid is a data point, not a non-event. Distinguish "declined: poor fit" from "declined: no bandwidth." The first is strategy. The second is a quantifiable capacity loss with a revenue value attached.
- Track cycle time by stage, not by deal. Elapsed time from inquiry to submission, broken down by triage, spec review, engineering, pricing, and assembly, shows where delay actually accumulates. A team that only tracks submission dates knows it is slow but not where.
- Attribute losses to causes. Late, non-compliant, priced-out, and lost-on-merit are different problems with different fixes. A loss taxonomy turns "we lose too many bids" into a ranked list of addressable leaks.
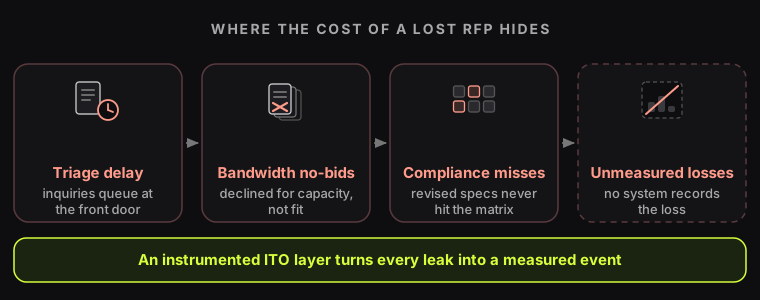
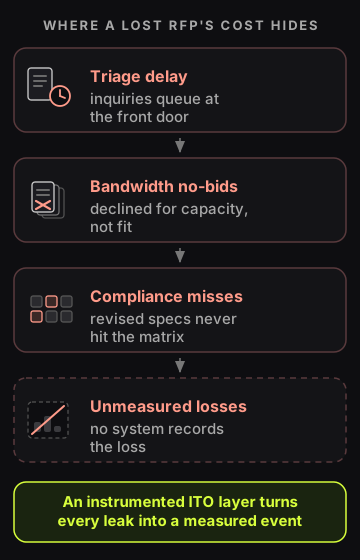
None of this requires exotic tooling to describe, but doing it manually is exactly the bandwidth problem the benchmarks surfaced. This is where a comprehension layer earns its place: software that reads the inbound documents, extracts the requirements, and instruments the workflow as a side effect of doing the work, rather than asking an already saturated team to also maintain the measurement.
What do the 2026 benchmarks show about delay and volume?
The 2026 benchmark picture is a volume squeeze: submissions are rising faster than the capacity to answer them well. Loopio's report puts average annual submissions at 166 per team, up 9 percent year over year, while half of all teams now name bandwidth as a top challenge, the first time it has led the list in seven years of data.
Two second-order findings matter more for industrial leaders than the headline volume. First, the same research shows more selective teams win a higher share of what they submit, which means the capacity-driven no-bid is doubly expensive: it removes a revenue shot and it usually removes the wrong one, because triage under pressure is not selection, it is queueing. Second, win rate benchmarks vary widely by region and industry, so the useful comparison is not your win rate against a global average but your own funnel, quarter over quarter, measured at every stage. A benchmark you did not instrument yourself is a conversation starter, not a diagnosis.
For an industrial bid team, the arithmetic that matters is simple to state even without publishing a number: if RFPs influence a large share of revenue, and bandwidth is forcing unqualified no-bids and rushed submissions, then the return on fixing the response workflow scales with everything downstream of it. That is why proposal response ROI is a board-level question and not a back-office one.
Put a number on your lost RFPs
See how an instrumented inquiry-to-order workflow counts every inquiry, logs every no-bid, and shows where delay and inaccuracy are costing you bids.
Where is this heading after the CPQ End of Sale?
The quoting-stack decisions industrial manufacturers make in the next two years will determine whether the lost-RFP number stays invisible for another decade. The Salesforce CPQ End of Sale window has boards asking what replaces or extends the configurator. The teams that treat this as a like-for-like swap will buy another rules engine and keep losing bids in the same unmeasured places. The teams that look honestly at their loss data, or discover they have none, will architect for the ITO layer where those losses actually occur.
The agentic AI wave points the same direction. As procurement teams adopt AI to evaluate more supplier bids faster, response teams face rising volume and tighter windows from the demand side too. And the re-shoring capex cycle in energy, infrastructure, and precision manufacturing keeps pushing more tenders into the market. Volume up, windows down, capacity flat: the cost of an uninstrumented response workflow only compounds from here. The category answer is a comprehension layer that reads the documents, operates the workflow, and makes every inquiry, no-bid, and loss a measured event. That is the space Ranger builds in.
Key Takeaways
- The cost of a lost RFP is invisible because CRMs and CPQs start counting after the costly part: triage delay, capacity no-bids, and compliance errors happen in the inquiry-to-order layer neither system sees.
- Loopio's 2026 benchmark data shows RFPs influence roughly 40 percent of company revenue while bandwidth has become the top challenge for response teams for the first time in seven years.
- Go/no-go discipline is eroding under volume pressure, with the share of teams using a formal process down 8 points to 75 percent, which means teams are losing bids they never deliberately chose to skip.
- Benchmarking proposal response ROI requires counting every inquiry at arrival, logging no-bids with reasons, tracking cycle time by stage, and attributing every loss to a cause.
- The Salesforce CPQ End of Sale is forcing a quote-stack decision; scoping it as a configurator swap leaves the ITO layer, where bids are actually lost, unmeasured for another decade.
The bids you lose without measuring them are the most expensive line item you will never see. For the full argument on why the ITO layer is where industrial revenue actually lives, read ITO vs CRM: Where Industrial Revenue Actually Lives and Why Inquiry-to-Order Is the Revenue Problem Nobody Is Measuring, or see how this plays out for precision manufacturers.